Identifying Modifiable Factors to Moderate Risk Factors for Susceptibility to Financial Scams in Older Adults
Aim
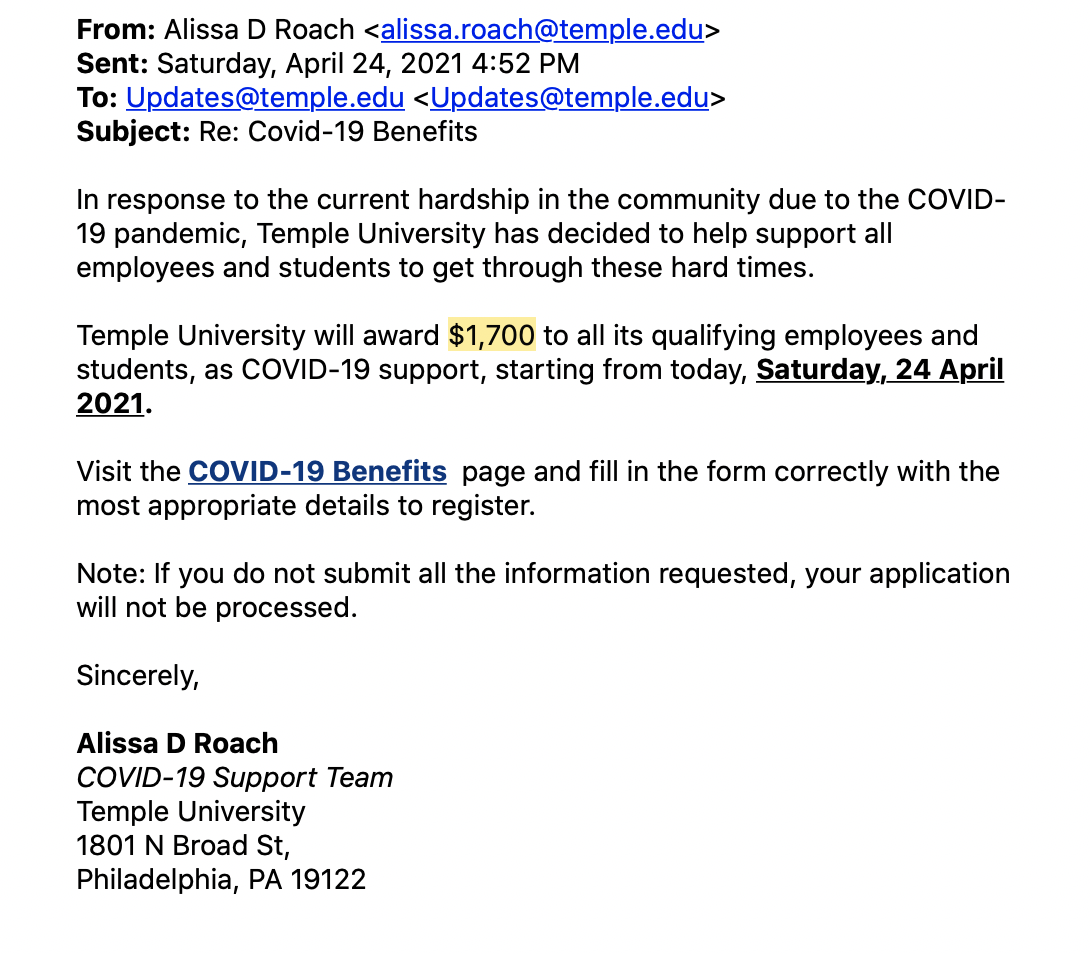
Financial scams are becoming more ubiquitous and sophisticated, especially with the aid of new technology. For example, Temple University faculty and students received this email recently that attempted to scam recipients into revealing credit card and social security numbers.
 Older adults are frequently the targets of
financial exploitation. With the growing population of older adults,
understanding how to combat this problem is crucial. Prior work suggests
that victims of financial exploitation are often from low socioeconomic
status groups (Choi & Mayer, 2000), have poorer cognitive functioning
(James et al., 2014), have more severe depression (Butters et al., 2008;
Dotson et al., 2010), and are more socially withdrawn (Choi & Mayer,
2000). However, very little is known about how different variables
moderate the effects of these known risk factors. My main goal is to
understand what/how modifiable factors can moderate the effects of
unmodifiable risk factors. I explore a few of these relationships to
identify the best policy recommendations by analyzing data from two
waves of a survey that I conducted in collaboration with faculty in
Temple University and Adelphi University’s faculty.
Older adults are frequently the targets of
financial exploitation. With the growing population of older adults,
understanding how to combat this problem is crucial. Prior work suggests
that victims of financial exploitation are often from low socioeconomic
status groups (Choi & Mayer, 2000), have poorer cognitive functioning
(James et al., 2014), have more severe depression (Butters et al., 2008;
Dotson et al., 2010), and are more socially withdrawn (Choi & Mayer,
2000). However, very little is known about how different variables
moderate the effects of these known risk factors. My main goal is to
understand what/how modifiable factors can moderate the effects of
unmodifiable risk factors. I explore a few of these relationships to
identify the best policy recommendations by analyzing data from two
waves of a survey that I conducted in collaboration with faculty in
Temple University and Adelphi University’s faculty.
Questions and Problem
While there are many risk factors associated with fraud susceptibility, I focus on a few here. First, I investigate whether trust is correlated with fraud risk since there is conflicting evidence in the literature (Choi & Mayer, 2000; James et al., 2014). I then ask whether physical health can moderate this relationship between trusting behavior and risk of fraud. I also investigate whether physical health and median household income, a proxy for socioeconomic status, can help moderate the relationship between social support and risk of fraud.
Scope
Survey data on financial susceptibility was collected in two waves. The first wave collected data on respondents from the Philadelphia metropolitan area, while the second wave collected data on respondents from urban, suburban, and rural areas across Pennsylvania; the goal of the second wave was to target areas with the highest and lowest socioeconomic statuses and the highest and lowest population densities. County-level median household income data came from the website, Income By Zip Code (Pennsylvania Income Statistics—Current Census Data for Zip Codes, n.d.). The results aim to find strategies to combat financial fraud in the Pennsylvania region.
Methods
Participants
Survey data was collected using Qualtrics’ panel data collection services. For the first wave, I recruited 625 participants aged 50 and older who resided within a 20-mile radius of the Philadelphia, metropolitan area. Our sample size was determined based on power calculations to detect group differences according to our primary hypotheses with an effect size of d = 0.40, 80% power and a significance level of p = 0.05. For the second wave, I recruited an additional 384 participants aged 50 and older, who alternatively resided in both urban and rural areas that encompass varying levels of household income within the state of Pennsylvania. Our sample size for study 2 was determined to achieve 80% power to detect interactions with an effect size of f = 0.25 at an alpha of 0.00555.
When the data collection period ended, I observed a total of 1,000 complete survey responses between our two studies, 625 from the Philadelphia region (wave 1) and 375 from non-Philadelphia areas throughout Pennsylvania (wave 2). Participants in wave 1 ranged in age from 50 to 91 years old (age: M = 62.2, SD = 7.9), with a majority identifying as female (57%) and White (81%). Participants in wave 2 were of a similar demographic makeup, with an age range of 50 to 82 years old (age: M = 61.6, SD = 7.2); 59% female, and 80% White. No participants were removed from the sample, and all participants electronically consented to participate in the study before completing the survey.
In our analyses for the second wave of data, our sample size per analysis changes slightly because I included participants who may not have completed all of the surveys but did for the measure(s) in question. For instance, if a participant completed the demographic, gullibility, and OAFEM questionnaires but not the need to belong questionnaire, then that participant would be used for all analyses involving demographics, gullibility, and/or OAFEM but not any that involve the need to belong scale.
Evidenced by the tables below, data is not equally balanced across demographics. Across both waves, there are more males than females/other, more white people than any other race, and more married people than any other marital status group.
| Gender | Wave 1 | Wave 2 |
|---|---|---|
| Female | 358 | 228 |
| Male | 266 | 156 |
| Other | 1 | 0 |
| Race | Wave 1 | Wave 2 |
|---|---|---|
| 1+ | 18 | 16 |
| Am. Indian | 5 | 5 |
| Asian | 8 | 7 |
| Black | 85 | 49 |
| Hawaiian | 1 | NA |
| White | 508 | 307 |
| Marital Status | Wave 1 | Wave 2 |
|---|---|---|
| Divorced | 97 | 42 |
| Married | 350 | 215 |
| Never married | 103 | 60 |
| Separated | 15 | 15 |
| Widowed | 60 | 52 |
Survey Scales and Questionaires ——————————-
While a larger corpus of surveys were utilized, I detail the main surveys used in the analyses here. The Older Adult Financial Exploitation Measure (OAFEM; Conrad et al. (2010)) is the main dependent variable of my analyses. It is a self-reported measure of risk for financial scams and asks questions like, “Has someone given you poor reasons for spending your money in the past twelve months?” I also use the PROMIS physical health scale (Hays et al., 2017). In order to measure a respondent’s ability to discriminate between trustworthy and untrustworthy behaviors, I used a new scale from Teunisse et al. (2020) that asks questions like, “You are usually quick to notice when someone is trying to cheat you.”
Data Analysis
In terms of scoring, I followed the directions outlined by each survey’s authors, except for the Older Adult Financial Exploitation Measure (OAFEM), a self-reported measure of susceptibility to financial scams the main dependent variable in the analyses. While it traditionally has four responses (i.e. yes, no, suspected, unknown), I only considered the yes and no answers for our scoring. Additionally, I used the optional categorization of questions based on the severity of the scam situation to weight certain questions over others. I then took the sum of each question. Because the data was heavily zero-inflated, OAFEM was categorized into three groups: “No risk,” which describes respondents with an OAFEM score of 0; “Low risk,” which describes respondents with OAFEM scores between 0 and the non-zero-median; and “High risk,” which describes respondents whose OAFEM scores are greater than the median.
Our scoring guidelines for socioeconomic status also differed between studies. In wave one, I took the sum of our four questions on socioeconomic status (i.e., the highest salary ever earned, current monthly expenses, level of educational attainment, and annual household income), each of which had eight possible answers to develop a socioeconomic status index that ranged from 4 to 32, 32 indicating a high socioeconomic status. After discovering data on median household income per zip code, I believed this would be a better proxy for accessibility to resources and therefore socioeconomic status. So, in wave two, I matched participants to the median household income for people over the age of 60 for his or her zip code of residence.
Additionally, I dummy coded the following variables: levels of educational attainment, race/ethnicity, gender, marital status, income, highest annual salary, and working situation. Due to the corner-solution in the OAFEM distribution, I split OAFEM into three tiers. I classified respondents who scored a zero on OAFEM as having “no risk” of fraud, respondents whose OAFEM scores were less than the median of the non-zero scores as being at “low risk” of fraud, and those whose OAFEM scores were greater than or equal to the median of the non-zero scores as being at “high risk” of fraud.
In terms of statistical analyses, in wave 1, I performed ANOVAs of the following form: Dependent ∼ OAFEM3 − tier*</sub> * *Moderato**r2 − tie**r,
where OAFEM3 − tier*</sub> refers to the trichotomized OAFEM measure and *Moderato**r2 − tie**r is a dichotomized independent variable split at the median.
Results
Trust and Financial Exploitation
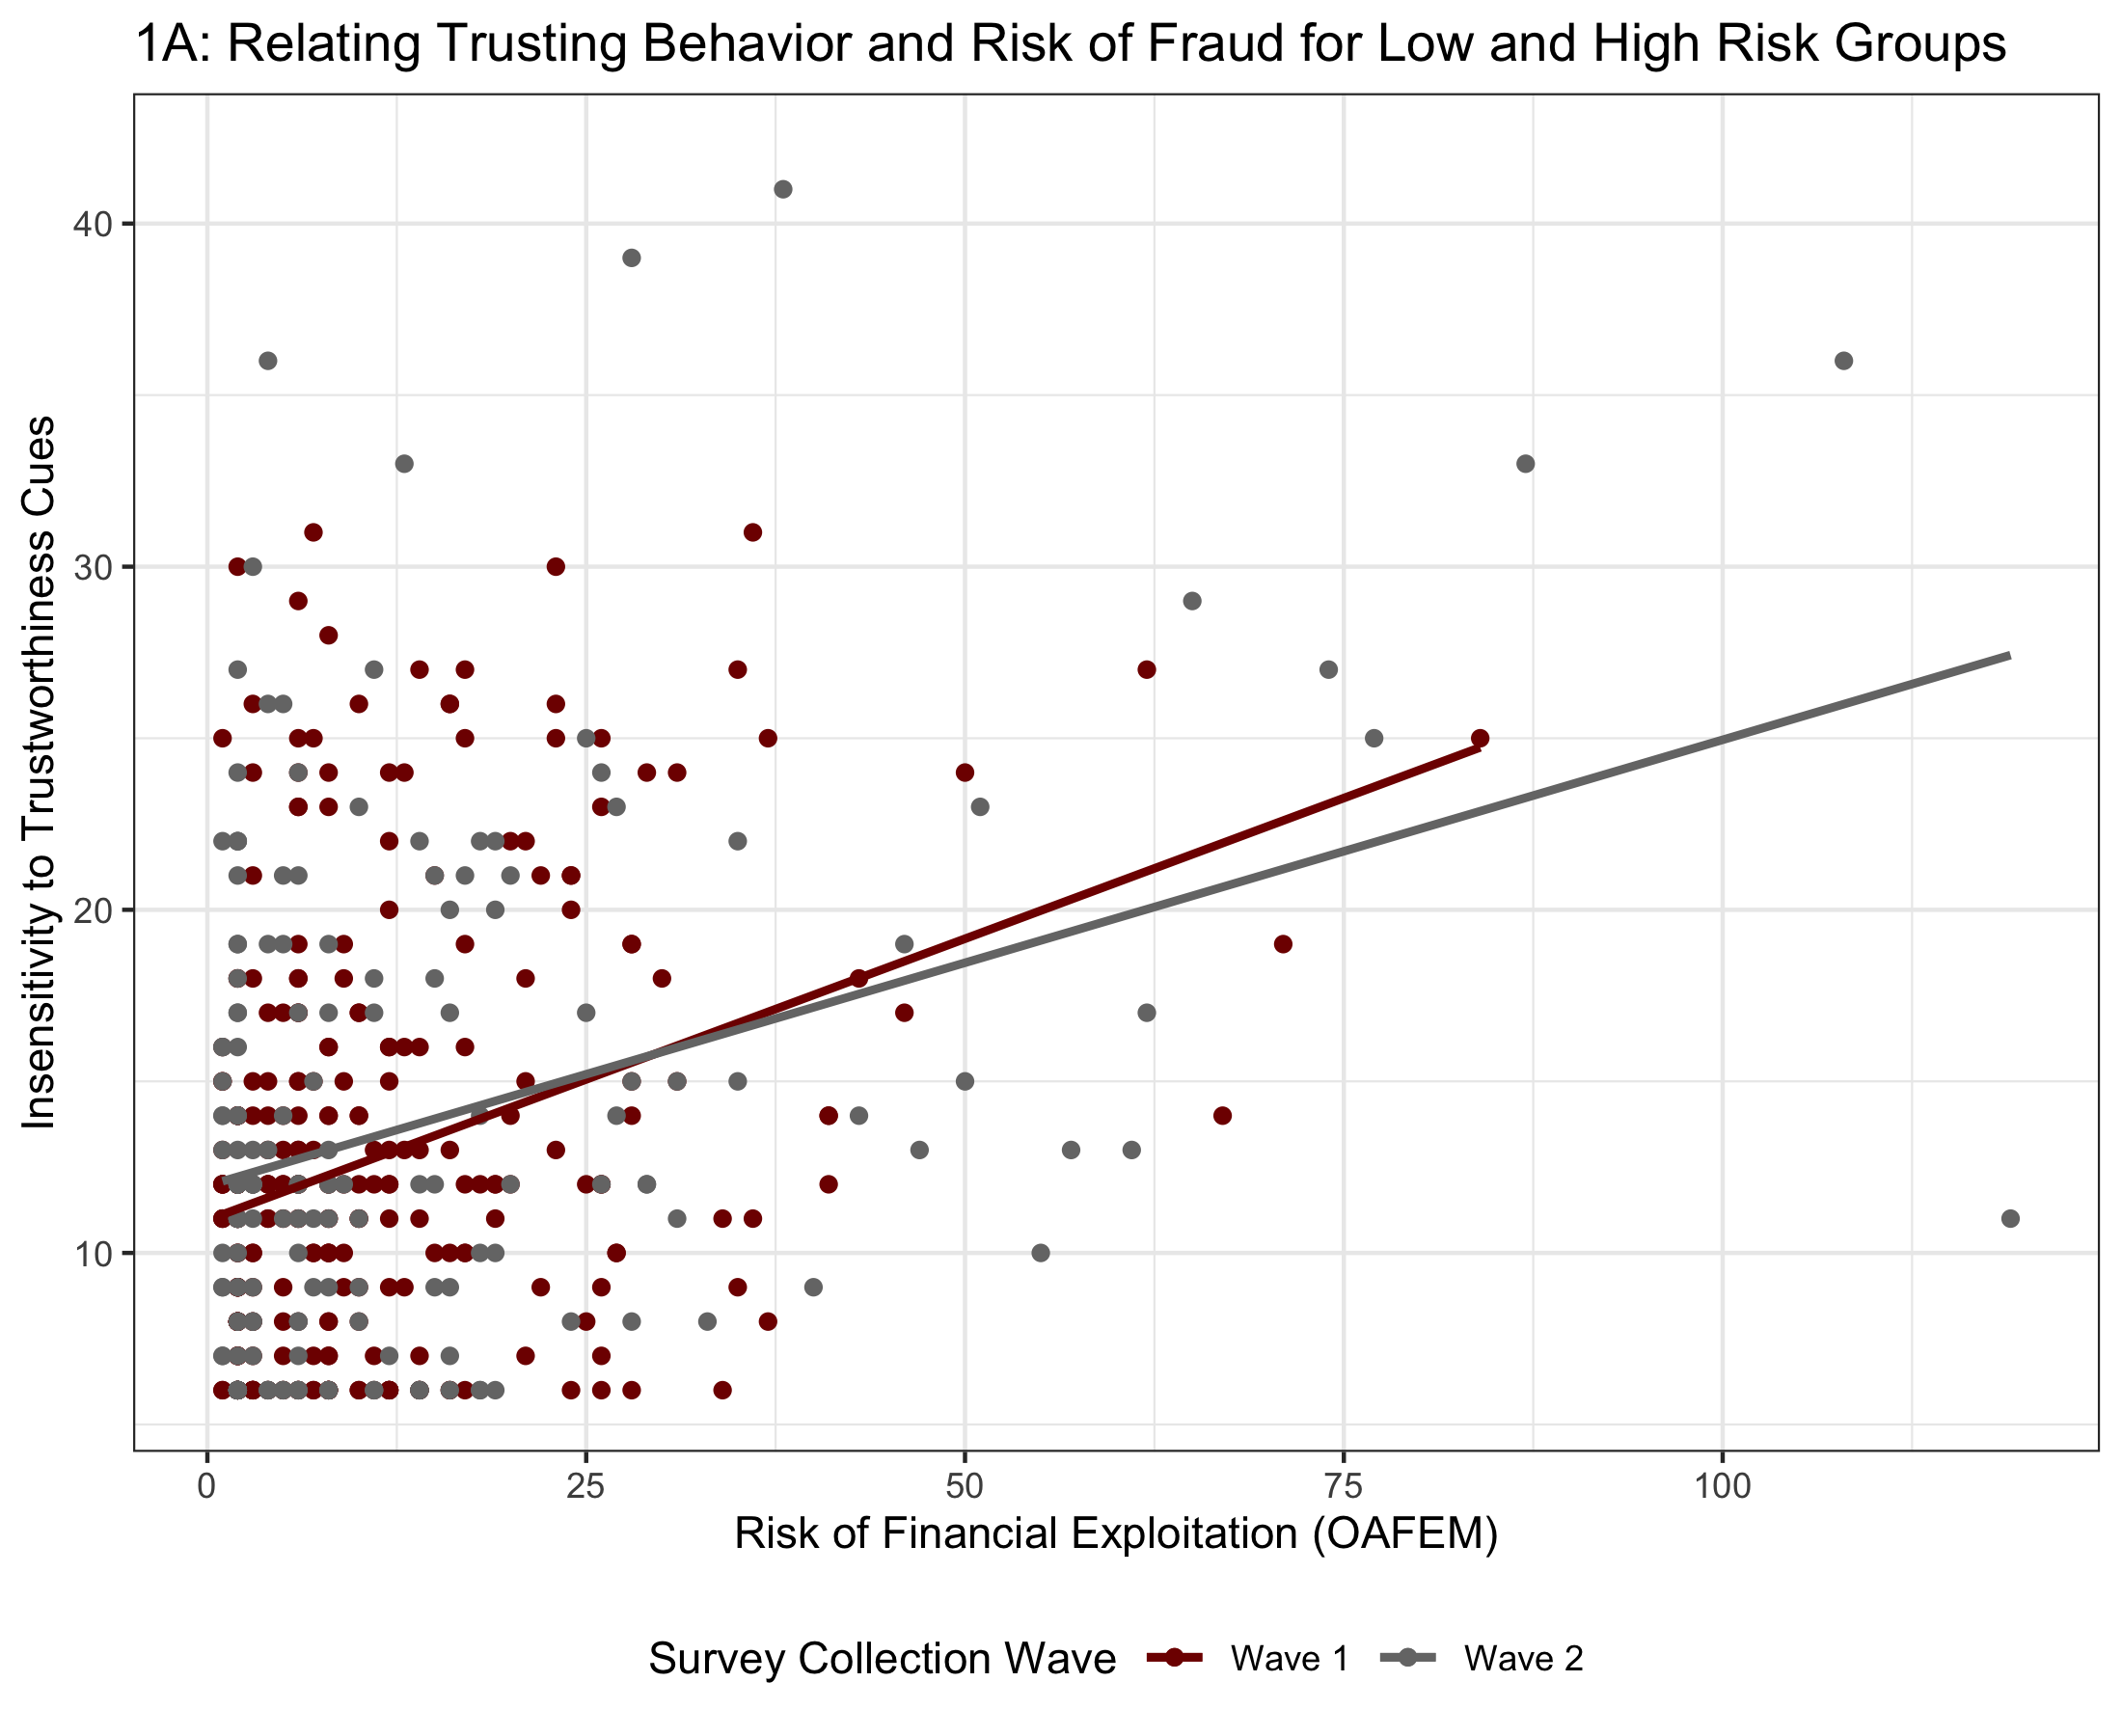
The role of trust in financial exploitation is somewhat contested; some claim that increased trusting behavior is positively correlated with risk of financial exploitation because they are more willing to believe the exploiter. On the other hand, some believe that trusting behavior is actually negatively correlated with risk for financial exploitation because while people are more prone to trust others, they are able to distinguish between credible and incredible cues. I first tested the relationship between Insensitivity to Trustworthiness Cues, a survey measure that captures someone’s ability to discriminate between trustworthy and untrustworthy behavior, and susceptibility to financial scams.
Figure 1A displays the relationship between risk for financial fraud and trusting behavior across both survey waves, specifically for the low and high-risk groups (i.e., OAFEM ≠ 0). Figure 1B displays how physical health can moderate the relationship between risk of financial exploitation and trusting behavior for wave one survey data. The bars represent 95% confidence intervals. And Figure 1B displays how physical health can moderate the relationship between risk of financial exploitation and trusting behavior for wave two survey data. Figure 1A demonstrates that across both waves of data collection, as the risk for fraud increases, so to does trusting behavior, suggesting that trusting behavior is a risk factor for financial exploitation. However, Figure 1B suggests that trusting behavior is statistically significantly moderated by health (F(1, 621) = 6.09, p = 0.014). Most evident is that the difference between trusting behavior within each risk group increases, with people with higher health being able to better identify trustworthiness; this change across risk groups suggests that improved health may reduce the relationship between trusting behavior and risk of fraud. However, the relationship does not exist in Wave 2 data (F(1, 366) = 0.44, p = 0.509), evidenced by Figure 1C, potentially because of differences in demographic factors.
## <ScaleContinuousPosition>
##  Range:
##  Limits:    0 --    1
Social Support and Financial Exploitation
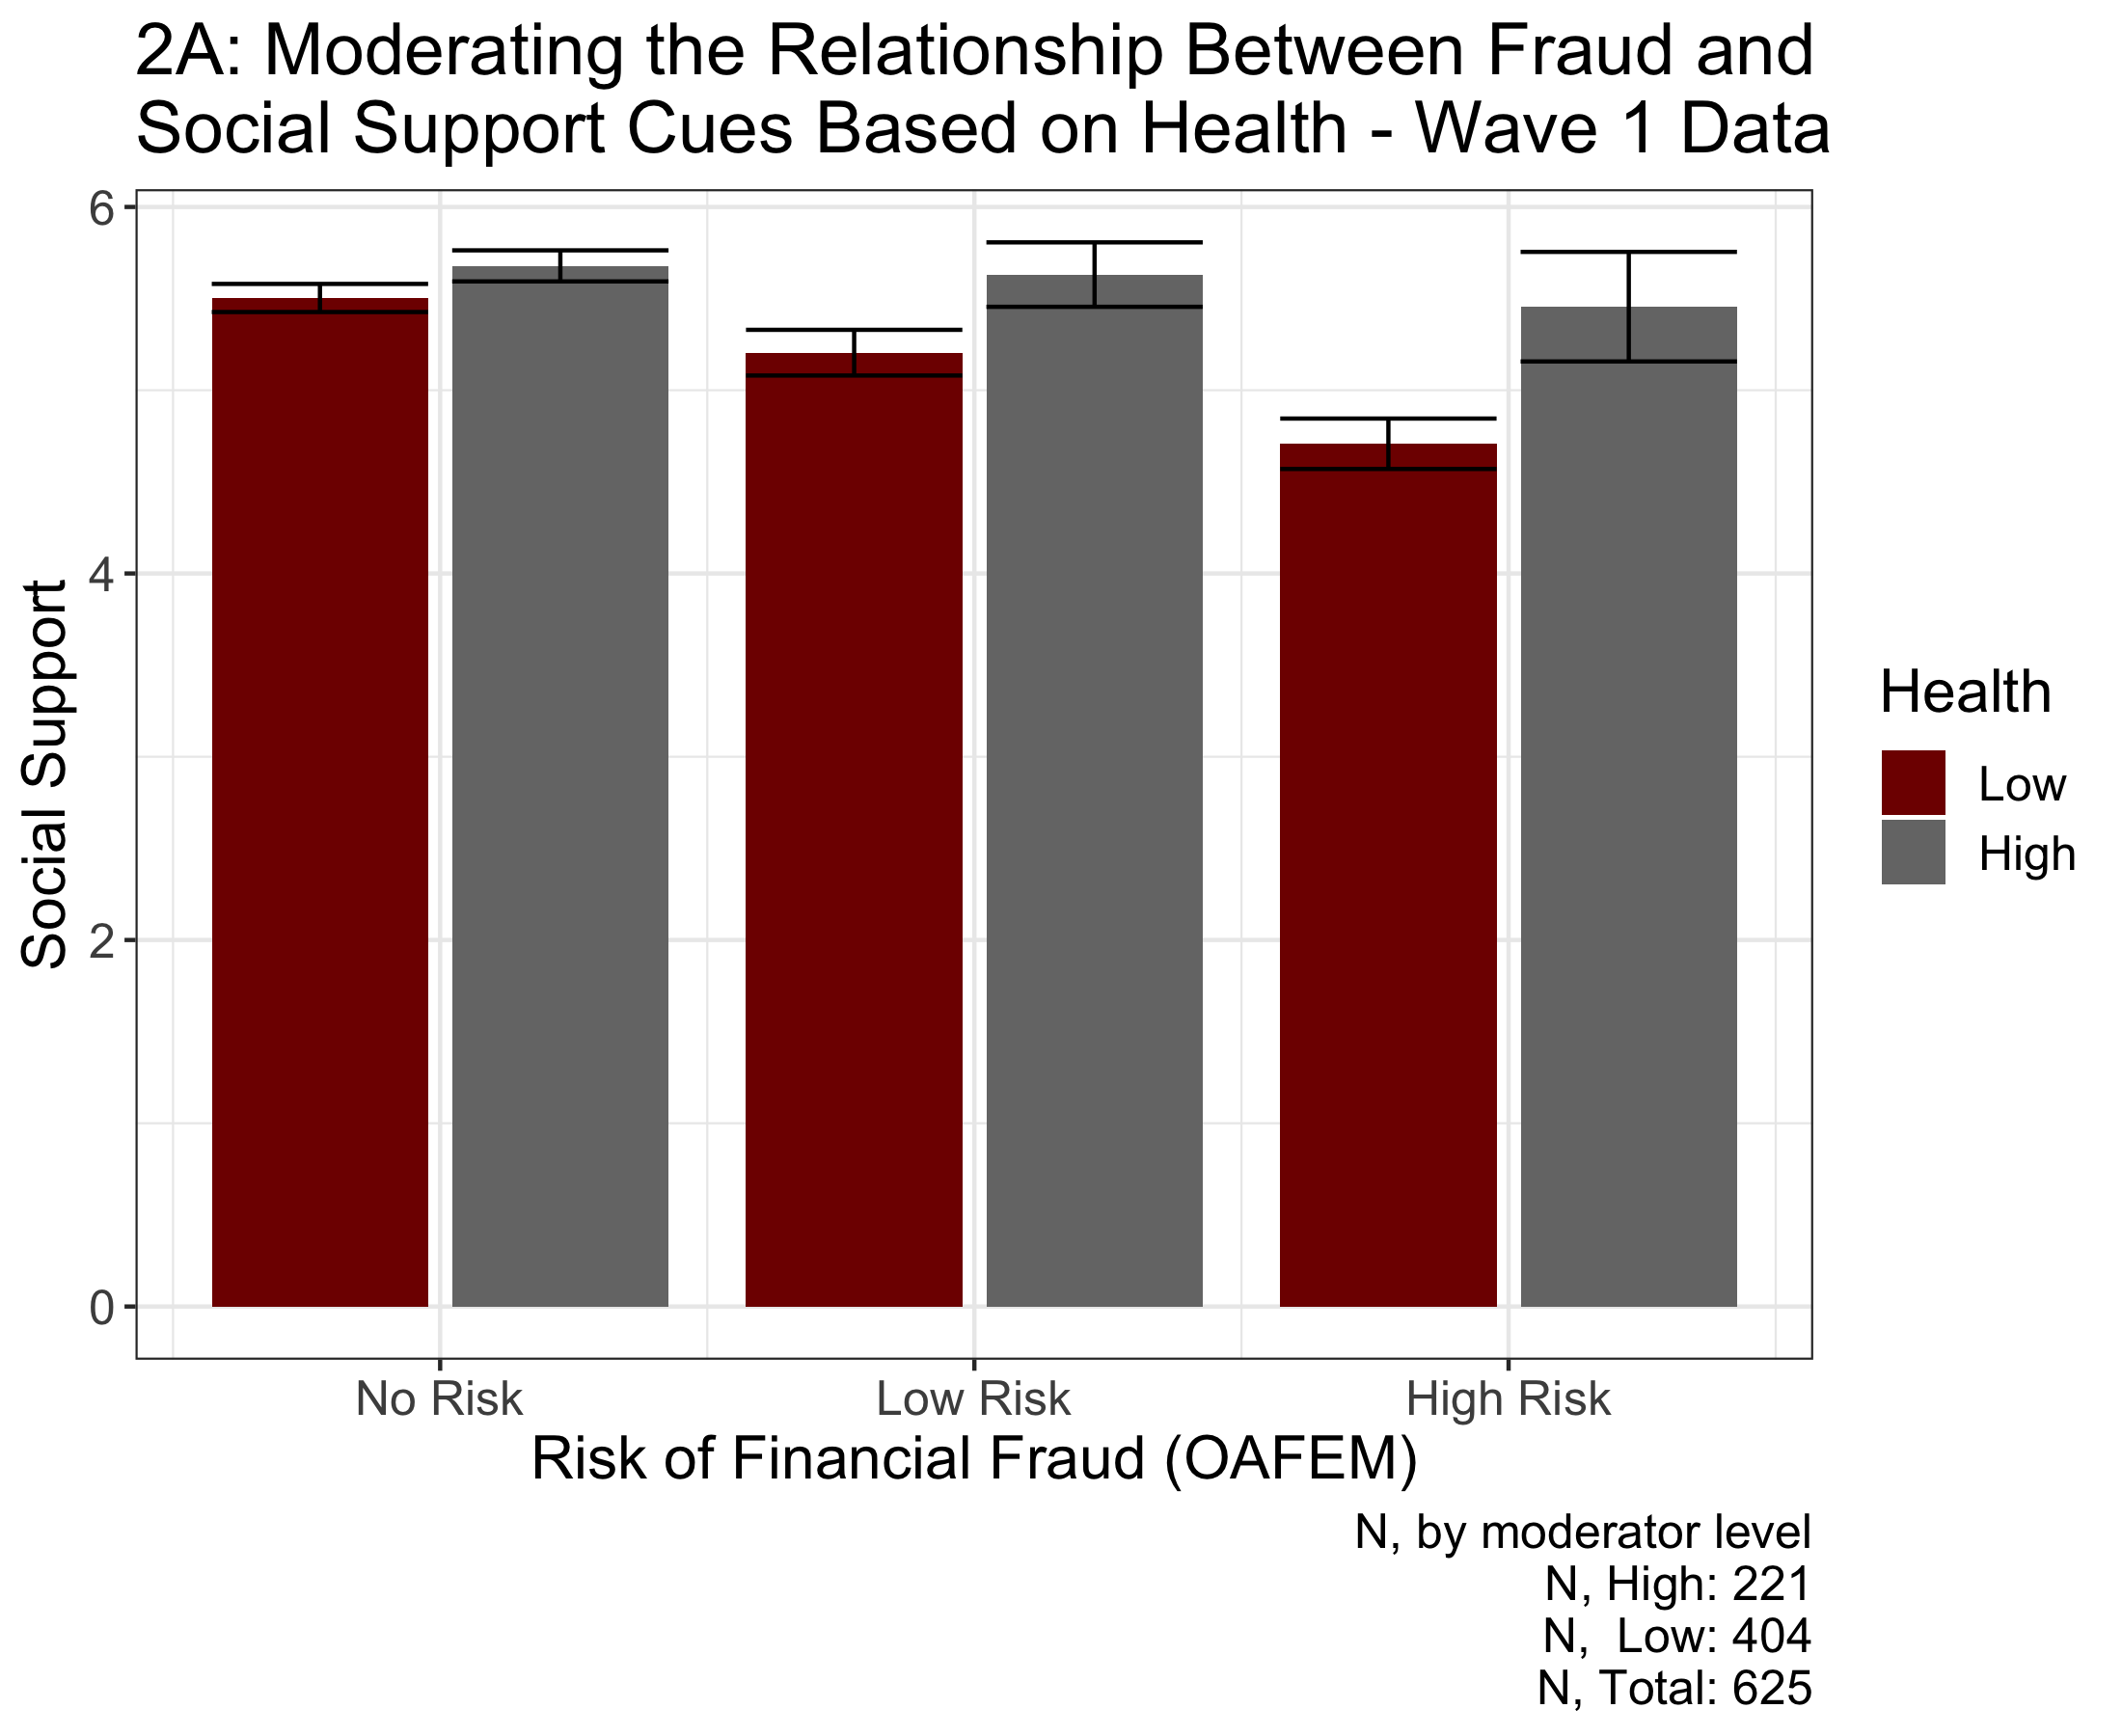
Significant research has demonstrated that social support is directly related to risk of fraud (Choi & Mayer, 2000; James et al., 2014). Interestingly, Roberto & Teaster (2011) reported that a large component of financial exploitation cases are perpetrated by friends and family (34%); those with poor social support are likely to be taken advantage of and financially abused. However, instituting policy interventions to alter social support and convincing older adults to take advantage of them are incredibly difficult. In order to counteract its effects, I explore how physical health and socioeconomic status moderate the relationship between risk of financial fraud and social support.
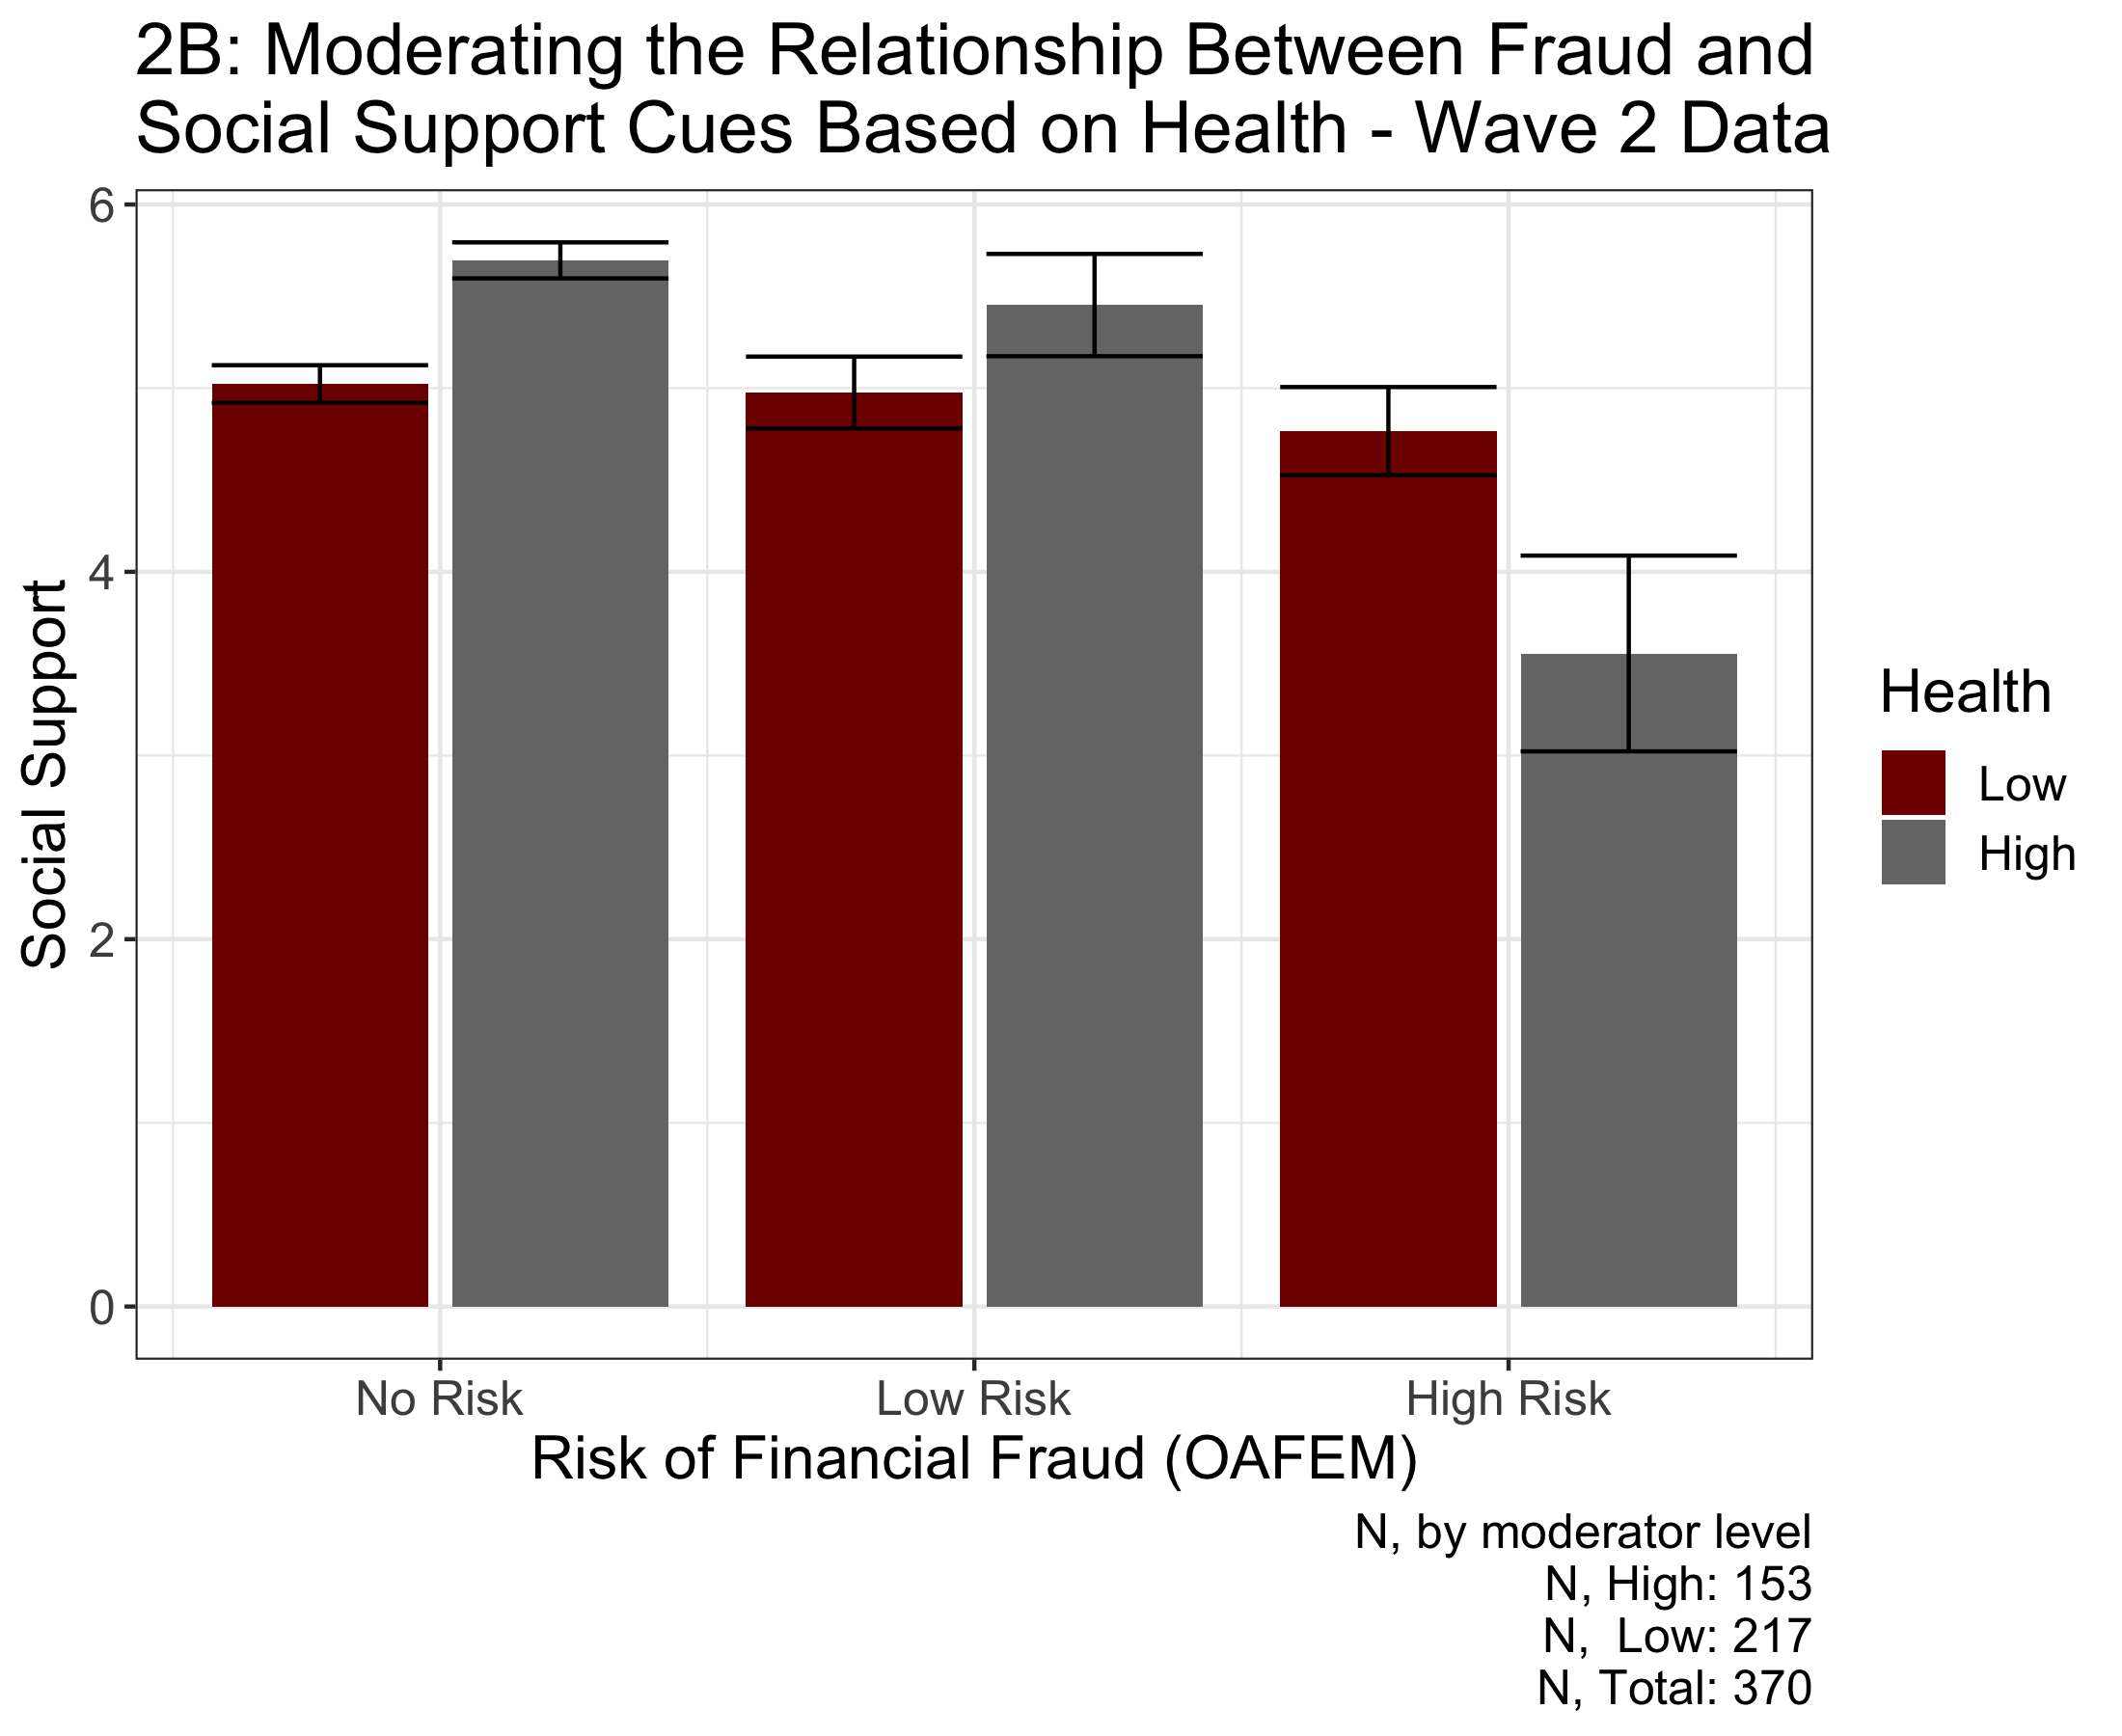
Figure 2A displays how physical health can moderate the relationship between risk of financial exploitation and social support for wave one survey data. Figure 2B displays how physical health can moderate the relationship between risk of financial exploitation and social support for wave two survey data. The bars represent 95% confidence intervals. Figure 2A suggests that social support is statistically significantly moderated by physical health (F(1, 621) = 4.258, p = 0.039). Furthermore, Figure 2A demonstrates that the difference between social support within each risk group decreases as risk group increases, with people with higher health having greater social support; this change across risk groups suggests that improved health may improve the reduce the association between a lack of social support and risk of fraud. The behavior is also replicated in the wave two data (F(1, 363) = 10.55, p = 0.001); however, unlike the wave one data, social support in the high risk group is significantly greater for the less healthy than the healthy, recommending that improved health can benefit people in the low risk group but not the high risk group.
<img src=”files/fraud_plots/ss_ses_anova1.png width=”50%” />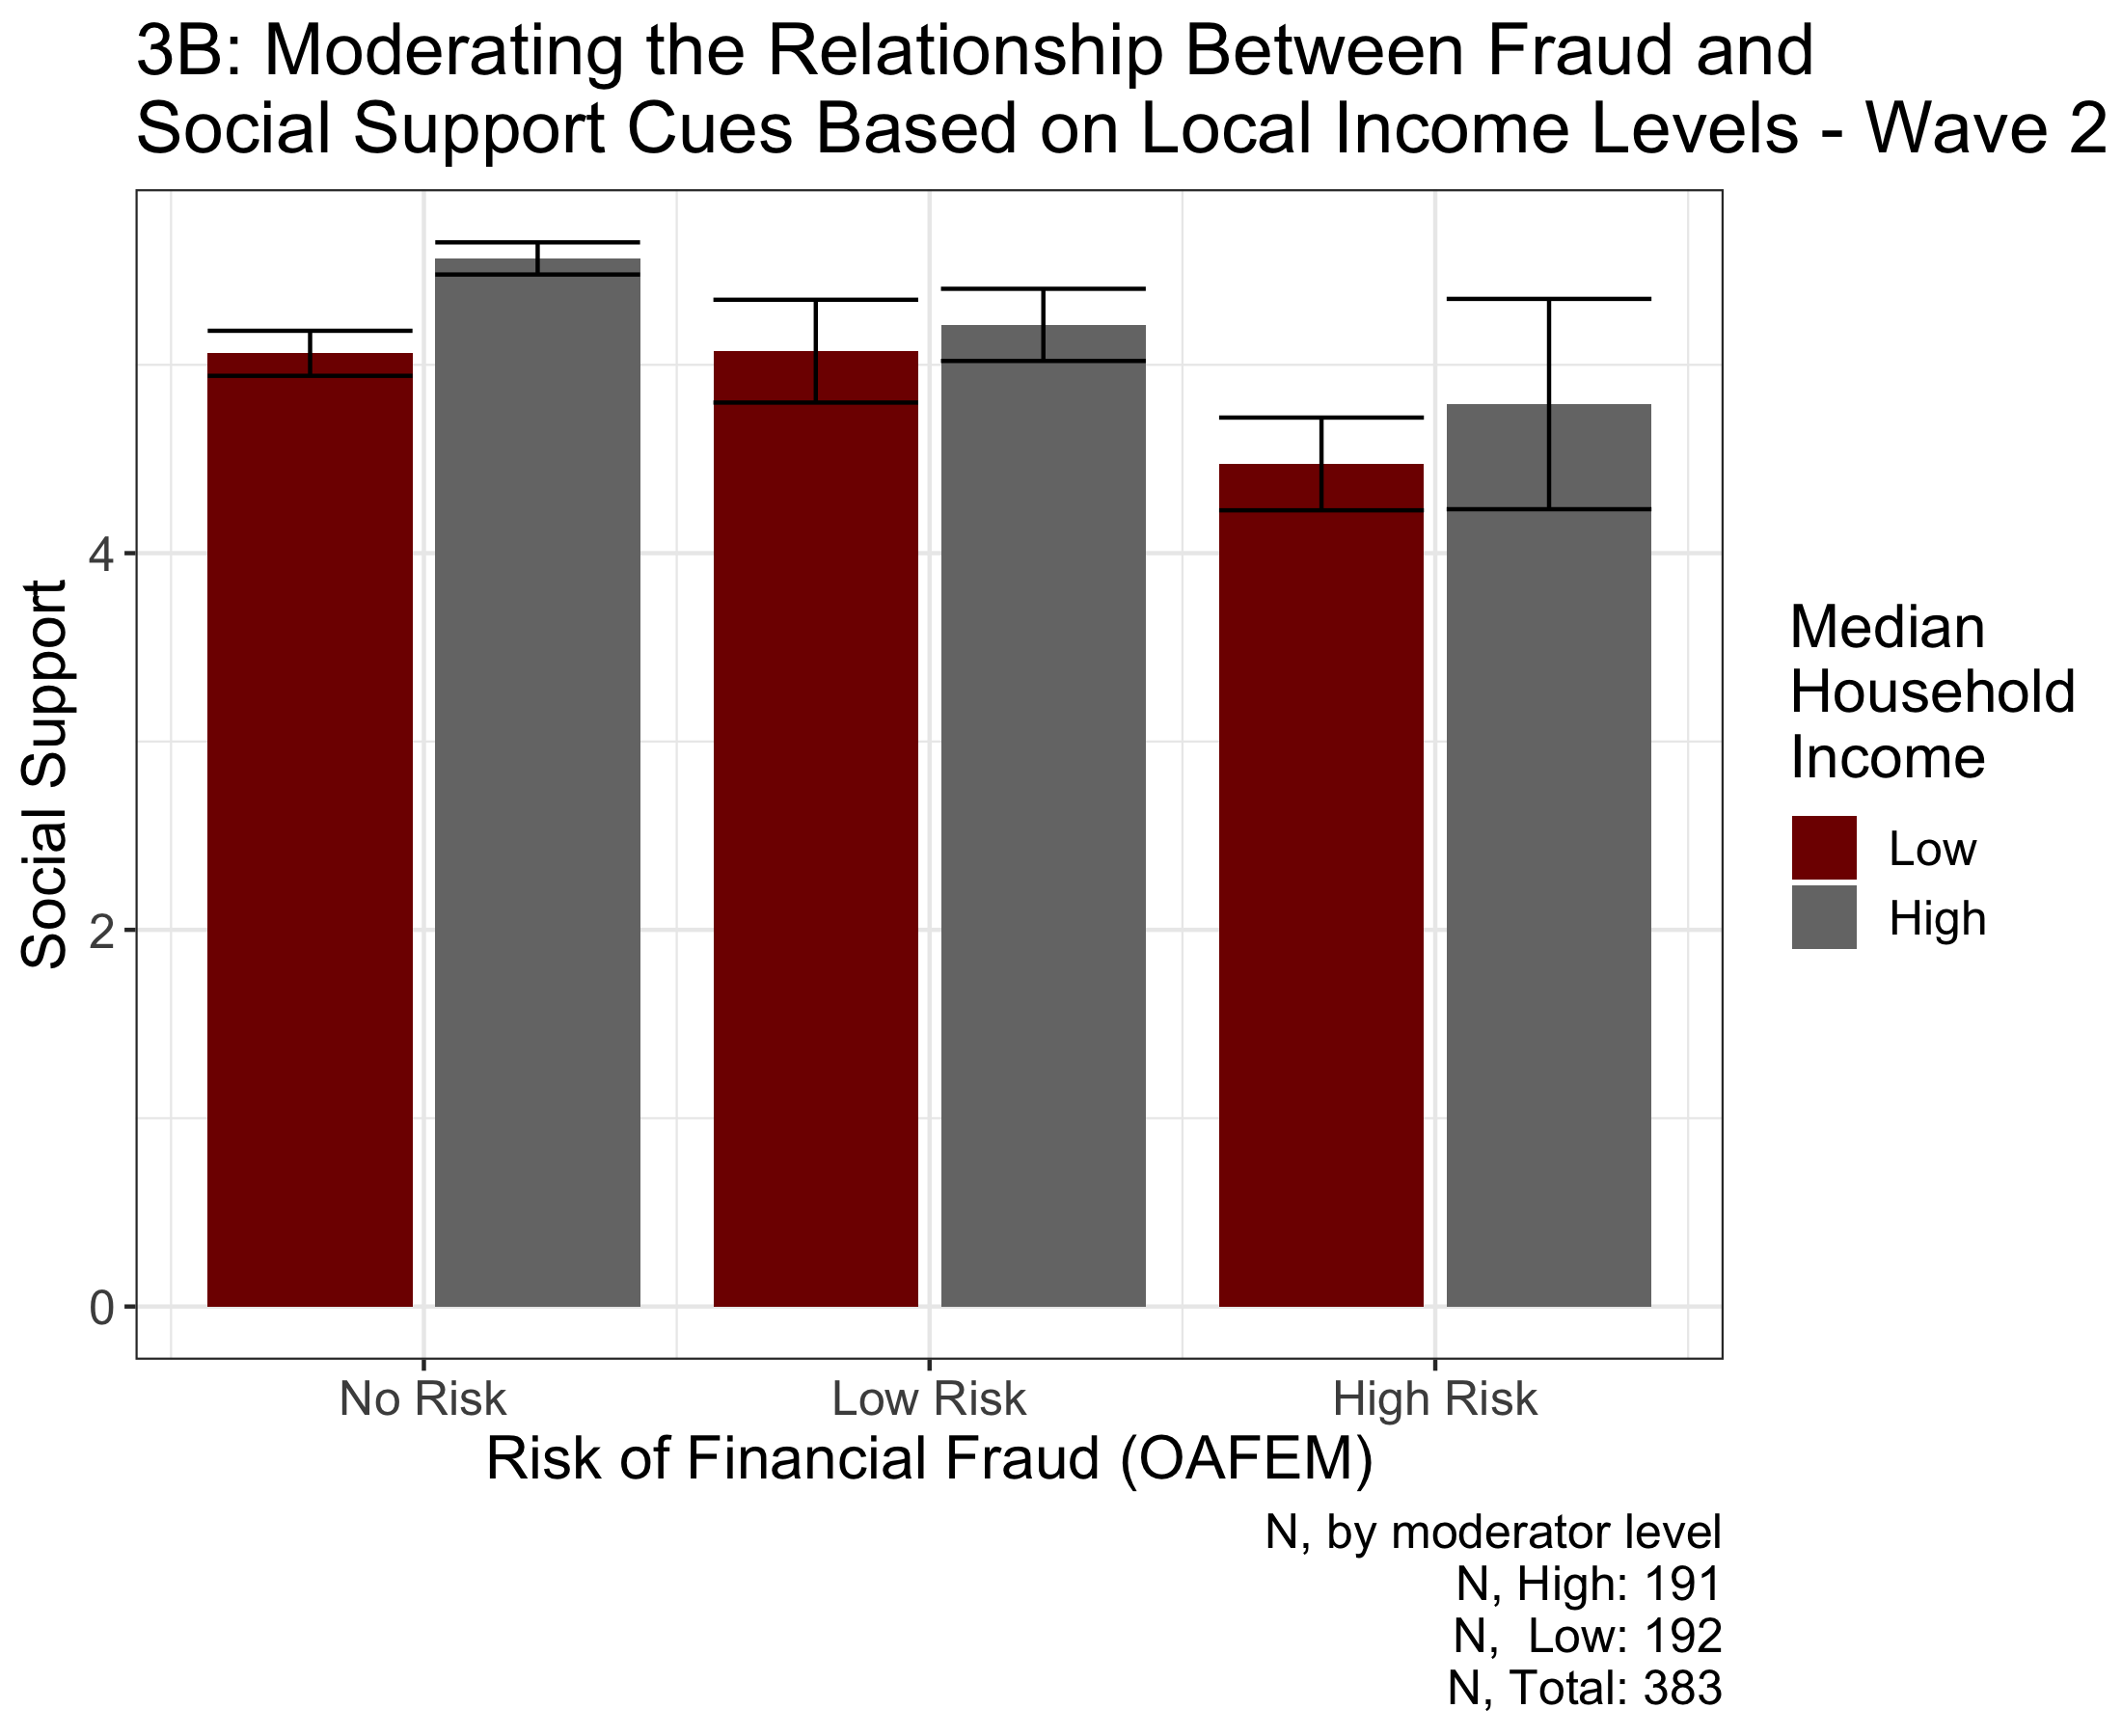
Figure 3A displays how improved local income levels cannot moderate the relationship between risk of financial exploitation and social support for wave one survey data. Figure 3B displays how physical health cannot moderate the relationship between risk of financial exploitation and social support for wave two survey data. The bars represent 95% confidence intervals. Figure 3A suggests that social support is not statistically significantly moderated by socioeconomic status (F(1, 466) = 0.794, p = 0.373). The behavior is also replicated in the wave two data (F(1, 362) = 0.25, p = 0.617), implying that local stimulus packages may not change the relationship between social support and risk of fraud.


Main Conclusions
While I found that insensitivity to trustworthiness cues is positively correlated with risk of fraud specifically for the people at low or high risk of fraud, health moderates this relationship. Therefore, in order to minimize the risk of fraud for people unable to discriminate between trustworthy and untrustworthy behaviors, I recommend instituting a randomized controlled trial to identify whether policies like free gym access can minimize people’s risk of fraud. Furthermore, I found that improved physical health can help minimize the association between low social support and risk of fraud, which is strong evidence to suggest instituting healthy-living programs for older adults. While I investigated whether median household income, a proxy for socioeconomic status, could moderate the relationship between social support and risk of fraud, I did not find evidence to suggest that is the case. Future extensions of this work will investigate the relationship between these moderators and risk factors in more balanced survey in the third wave of data collection. While surveys are not conclusive evidence of causal relationships and sometimes lack ecological validity because of self-reporting, these results mark an important first step in combating financial fraud.
References
Butters, M. A., Young, J. B., Lopez, O., Aizenstein, H. J., Mulsant, B. H., Reynolds III, C. F., DeKosky, S. T., & Becker, J. T. (2008). Pathways linking late-life depression to persistent cognitive impairment and dementia. Dialogues in Clinical Neuroscience, 10(3), 345.
Choi, N. G., & Mayer, J. (2000). Elder abuse, neglect, and exploitation: Risk factors and prevention strategies. Journal of Gerontological Social Work, 33(2), 5–25.
Conrad, K. J., Iris, M., Ridings, J. W., Langley, K., & Wilber, K. H. (2010). Self-report measure of financial exploitation of older adults. The Gerontologist, 50(6), 758–773.
Dotson, V. M., Beydoun, M. A., & Zonderman, A. B. (2010). Recurrent depressive symptoms and the incidence of dementia and mild cognitive impairment. Neurology, 75(1), 27–34.
Hays, R. D., Schalet, B. D., Spritzer, K. L., & Cella, D. (2017). Two-item promis global physical and mental health scales. Journal of Patient-Reported Outcomes, 1(1), 1–5.
James, B. D., Boyle, P. A., & Bennett, D. A. (2014). Correlates of susceptibility to scams in older adults without dementia. Journal of Elder Abuse & Neglect, 26(2), 107–122.
Pennsylvania income statistics—current census data for zip codes. (n.d.). https://www.incomebyzipcode.com/pennsylvania.
Roberto, K., & Teaster, P. (2011). The metlife study of elder financial abuse: Crimes of occasion, desperation, and predation against america’s elders.
Teunisse, A. K., Case, T. I., Fitness, J., & Sweller, N. (2020). I should have known better: Development of a self-report measure of gullibility. Personality and Social Psychology Bulletin, 46(3), 408–423.